“An almost playoff game and you decide to turn down points because something called analytics says it’s smart,” Mike Lombardi, a writer, broadcaster and former NFL general manager, tweeted last December. “You deserved to lose last night — more proof each game is different and each situation is a stand-alone. No chart or some kid in a basement playing Madden can help.”
It was the morning after the Los Angeles Chargers had suffered a gut-wrenching home loss to the Kansas City Chiefs. The game itself was a thriller, with the Chiefs scoring the first 10 points and the Chargers scoring 21 of the next 24 before a back-and-forth fourth quarter sent the game to overtime. Just 75 seconds into the extra period, a 34-yard Patrick Mahomes-to-Travis Kelce pass gave Kansas City a 34-28 win.
The teams combined for 924 yards and 54 first downs, but the story of the game came from a handful of times the Chargers couldn’t move the chains or put the ball in the end zone. They went 2-for-5 on fourth downs, turning the ball over on downs in Chiefs territory at the 5-yard line in the first quarter, at the 1 on the final play of the first half and at the 28 early in the second half.
This wasn’t unusual for Brandon Staley’s Chargers. They made multiple fourth-down attempts in seven games in 2021. As Staley told the media after the Chiefs game, “That’s the way we’re going to play.” They went a combined 7-for-10 in midseason wins over the Las Vegas Raiders, Cleveland Browns and Philadelphia Eagles and an incredible 6-for-7 in their wild, Week 18 loss to the Raiders. But the successes went mostly unacknowledged by Lombardi and other critics.
A sports argument is never, ever settled. If you think nerds are ruining [insert sport here], then you probably always will. But the vociferous nature of the pushback against Staley seemed almost like a “last throes” moment of sorts, and the old nerds-in-basements trope felt stale. If the past few seasons of both pro and college football have taught us anything, it’s that the sport is listening to the nerds a lot more than it used to.
How Lane Kiffin gave the nerds a boost
Michael McRoberts was working for a credit bureau a decade or so ago when curiosity got the best of him.
“Watching games, some of the decisions that coaches were making just didn’t seem right to me,” he said. “I was on a road trip for business, and I went into Excel and started to do some calculations. The math really didn’t match up to the choices.”
He got his hands on some college football play-by-play data and started crunching numbers. “What occurred to me was that there are a lot of tools out there, but there really weren’t many people trying to help the coaches themselves make decisions” on matters like fourth downs and 2-point conversions, he said. “That really became the inspiration. Could we put together something where, if a situation came up in the game, we could give a coach the mathematical recommendation to use as part of the decision-making process?”
This question became the raison d’etre for forming Championship Analytics, or CAI.
It started with one school, then a few, then a few more. Now CAI provides decision books for more than half the teams in the FBS, plus four NFL teams and teams at both the small-college and high school levels.
“There was not a gigantic mission at the start,” McRoberts said. “It was truly just crunching some numbers in a spreadsheet when I got stuck in a storm in Buffalo. And here we are.”
One of CAI’s first public breakthroughs came in 2017 and ’18, when Army, a CAI client, went a combined 21-5. The Black Knights played the margins beautifully, not only attempting 66 fourth-down conversions but succeeding on 50 of them and going 10-3 in games decided by one score. Head coach Jeff Monken openly referenced to the media the help CAI had provided his team.
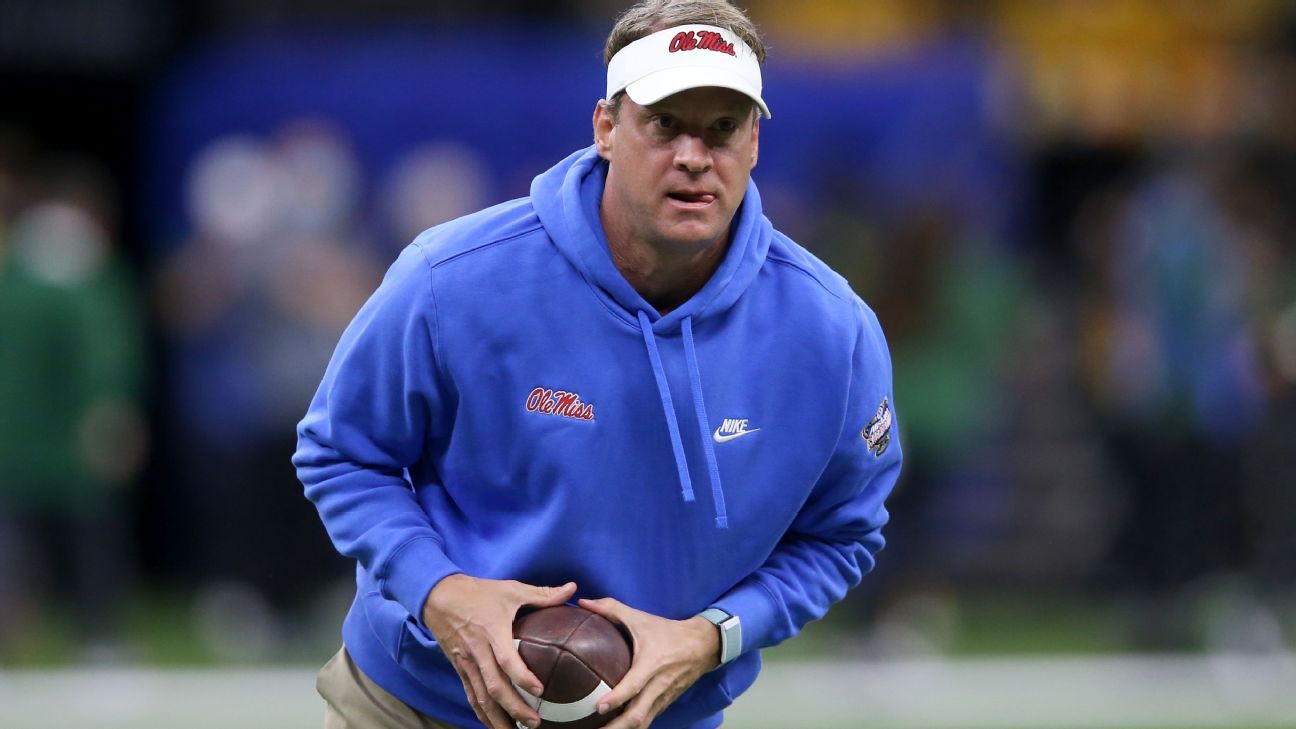
Only two teams went for it more than Army in this span, albeit with fewer successes: rival Navy and Florida Atlantic, with a staggering 83 fourth-down attempts. FAU’s head coach at the time? Lane Kiffin.
Kiffin had already lived a full football life — USC offensive coordinator at age 30, Oakland Raiders head coach at 32, fired USC head coach at 38 — when he landed the offensive coordinator gig for Nick Saban at Alabama in 2014. By the end of his three seasons in Tuscaloosa, the Tide had become a CAI client, and Kiffin had gotten a chance to peruse their materials, immerse himself in their game books and realize just how many of his, and most coaches’, assumptions were flawed.
He quickly concluded that if or when he got another head-coaching opportunity, he would commit to innovation in two ways. First, he would combine a lot of pro-style concepts and present-day bells and whistles (motion, et al) with what he called “Baylor tempo,” reminiscent of the 85-plays-per-game Baylor offenses of the early 2010s. Second, he would go all-in on the math. He would quickly become CAI’s most vocal client.
After winning two Conference USA titles in three years at FAU, Kiffin earned a trip back to the SEC as head coach at Ole Miss, and he has remained committed to those initial tenets. Over the past two seasons, his Rebels have averaged more snaps (78.9) and more fourth-down conversion attempts per game (3.6) than anyone else in the FBS. Sometimes it works beautifully, as when Ole Miss went 4-for-4 on fourth downs against eventual national champion Alabama and had the Tide on the ropes deep into the fourth quarter. Other times, it fails for all to see, as when the Rebels went a Chargers-esque 2-for-5 against Bama in 2021, failed on the first two drives of the game and got blown out.
“You’re supposed to go for it a lot in situations that people aren’t used to seeing,” Kiffin said. “That makes it challenging because when you don’t get it, not only does it look bad, it looks bad in front of 100,000 people and national TV and you’re answering to the media afterward, and the announcers are saying how dumb that is.”
He likened the risk to playing blackjack: Knowing the odds, when to hit on 16, etc., is one thing, but pulling the trigger with actual money on the line is another. “You’ve got thousands of dollars down on that hand, and it gets a lot harder to hit.”
That has proven true at both the college and professional levels of football, but like Staley, Kiffin has shown he’s willing to hit, and it has paid off. He took over an Ole Miss program that had gone just 20-28 over four seasons while working back from NCAA sanctions; after a 5-5 debut, his Rebels went 10-3 in 2021. Their No. 11 finish in the AP poll was their second best since 1969.
Ole Miss’ fourth-down usage remains an outlier, but at both the college and professional levels — where every NFL team is employing analytics professionals at this point — the trends are clear.
Over the course of five seasons, FBS teams went from going for it 60% of the time on fourth-and-1 to 74% — 92% of the time in opponents’ territory and 48% in their own. NFL teams, meanwhile, went from going for it 44% of the time to 70%. On fourth-and-2, college teams went for it 13 percentage points more, NFL teams 23 percentage points more. The math favors going for it on longer fourth downs even more than that in plenty of scenarios, so there’s still room for growth, but that is a massive shift in a short amount of time.
“The whole fourth-downs thing is visually obvious,” Football Outsiders’ Aaron Schatz said. “That dramatically changed in 2018 and has been very different since.”
“It’s exploded, frankly,” said Brian Burke of ESPN Stats & Information. “There’s lots of ways to measure fourth-down stuff, and it’s so situational that you can’t just look at raw fourth-down go-for-it rates, but even if you just look at that, it’s doubling, if only because the base rate was so low.”
“But in all these areas,” ESPN’s Seth Walder continued, “fourth downs, two points, teams don’t behave optimally on those yet.”
“There are the [NFL] teams that themselves have the resources to develop their own models, and some use vendors to provide models,” Burke said. “They’re using it for more than just fourth downs, too. Obviously 2-point conversions, but all kinds of game management stuff — taking intentional penalties near the goal line, onside kicks, clock management stuff. You’ve got some teams with an analytics person in the booth now on the headsets,” which, among other things, can help teams to avoid wasting timeouts.
“I think another big change is, teams are thinking of their third-down playcall in conjunction with the fourth-down recommendation,” McRoberts said. “Third-and-7 is not automatic throw to the sticks and the binary zero-one result — maybe they throw a pass short of it or even run just to try to, if nothing else, get themselves in that fourth-down ‘go’ range.”
At the NFL level, 35% of fourth downs now require 4 or fewer yards to go as opposed to 31% in 2017, which suggests that pro teams are indeed doing a better job of setting up these opportunities. (That data hasn’t changed much at the college level just yet.)
“We explain the philosophy to the players early on here,” Kiffin said. “They understand our aggressive style — whether it’s fakes, whether it’s fourth downs, whether it’s a lot of blitzes, whatever it is, they know it’s belief in the players. That’s belief that you’re gonna make a play.”
Of course, there’s one more unit that needs fourth-down affirmation: the defense.
“The defense also understands that this is about analytics,” Kiffin said. “This is not because we don’t believe in the defense. If you don’t explain that, if your team doesn’t understand what you’re doing, it can backfire because the defense thinks, well, they’re going for it ’cause they don’t think we can stop them.”
It’s also OK to occasionally put faith in the punter.
“It’s a huge factor in the models that if it’s expected to be a low-scoring game, and you’ve got a phenomenal punter, that fourth-and-1 is not an automatic go all the time in minus territory,” McRoberts said. “There are definitely circumstances where punting is the play.”
“We play Texas A&M, and we go for it on the 1 and don’t make it,” Kiffin said, recalling the Rebels’ 2021 game against the Aggies. “Probably most people watching this know, ‘You take the three points.’ A lot of very successful coaches would take the three because that’s just what you’re trained to do. When you don’t make it, ‘Oh, it’s so bad, it’s so bad,’ but now the ball is on the 1, and you have a chance to get a safety and get the ball back.”
That’s exactly what happened against Jimbo Fisher’s Aggies. After a fourth-down failure by the Ole Miss offense in the second quarter — which followed a fourth-and-2 touchdown in the first quarter — the Rebels’ Chance Campbell and Mark Robinson stuffed Isaiah Spiller in the end zone for a safety, giving Ole Miss a 15-0 lead en route to a 29-19 upset win.
A&M’s only fourth-down attempt, by the way, came in the final minute in a desperation situation. This wasn’t much of a surprise — the Aggies had just 10 fourth-down attempts all season, fewest in the nation.
“It’s everybody’s choice whether you follow analytics or not,” Kiffin said, “but you know when you’re playing certain coaches, well, if we’re playing A&M, and it’s fourth-and-1, no matter where the ball is we’re just sending out our punt return team. They’re going to punt. That’s Jimbo, and I think he’s even quoted as saying, you know, ‘The game’s not played in a book, I’m not looking at a stupid book.'”
Fisher’s Aggies have gone a combined 17-5 over the past two seasons, of course, just as the fourth-down allergic Los Angeles Rams won the Super Bowl in 2021. Punting on fourth-and-short doesn’t automatically prevent teams from winning games. But the past few seasons have shown that more coaches are coming to understand that in many instances, punting is the risk, as opposed to going for it.
Catching up on 2-point conversions
If fourth-and-short plays were always going to be the first front of the analytics debate, 2-point conversions were always going to be second.
The math is straightforward, and historically, coaches haven’t used them as frequently as they probably should. But they’re catching on.
In the 2021 season of the NFL, where conversions take place from the 2-yard line, math — 0.97 expected points for 2-point conversions, 0.93 for extra-point kick attempts — favors much more frequent 2-point attempts than we see, and they have indeed risen in frequency over the past five seasons. In college football, 2-point attempts are from the 3-yard line, which lowers the percentages. But attempts have still risen a bit.
What other low-hanging fruit is out there?
“That’s easy,” Burke said when asked where other tendencies could shift at the NFL level, “and it comes out of the exact same models [that told teams to go for it more on fourth down]: play selection. Run versus pass, screen versus play action.”
For a long time now, passing has been more efficient at the NFL level than running, but the desire to “establish the run” remains high.
“The pass-run ratio has actually gone down a little bit in the last two years,” Schatz noted. “It was at its highest in 2016. It was gradually moving toward more passes, but then that reversed itself the last couple of years. We’ll have to see whether that’s permanent or just a little blip.”
Indeed, while much was made of an increase in passing, and the increased importance of the always-important quarterback position, rates really haven’t changed that much over time. In 2001, NFL teams attempted passes 56.0% of the time in the regular season and playoffs; 20 years later, it had increased to only 58.1%. Even at its pass-happy peak in 2016, the league was attempting to throw only 59.4% of the time.
Are offenses somehow growing more conservative even as their fourth-down decision-making is growing more aggressive? Maybe, but defenses have played a role in run rates as well.
“Look at pass rate when you remove all RPO [run-pass option] plays,” said Tej Seth, an intern for Pro Football Focus and a prolific member of what might be called Football Analytics Twitter. “The pass rate hasn’t risen as much as it’s been made out to be. When an offensive coordinator is calling an RPO, they’re considering it as a run call, but sometimes the quarterback is pulling it [and throwing]. It’s made the pass rate rise, but we’ve also seen the rise of the two-high defense” that defensive coaches, like Vic Fangio and Staley, have begun implementing to better take away vertical passing. “In college, you have the Big 12, where they started committing three high safeties, too. It encourages the run a little bit more on those plays where the quarterback can decide to run or pass.”
First downs remain a particularly ripe opportunity for increased pass rates.
NFL offenses on first downs, 2021 regular season and playoffs
Rushing: 35% success rate (gains of at least 5 yards), 4.3 yards per play, 0.4% turnover rate
Passing: 50% success rate, 6.7 yards per play, 2.5% turnover rate
Despite the increased turnover rate, there is a massive difference in both efficiency and explosiveness when throwing on first down. The Buffalo Bills have figured this out, attempting passes 58% of the time on first downs in 2021, but the other 31 teams in the league did it only 49% of the time. Of course, Buffalo is one of the teams most recognized for its deployment of analytics.
“Buffalo is well regarded by other analytics staffers [throughout the NFL], and there might not be a team more willing to eschew the run-pass stuff,” said Walder, who helps to arrange ESPN’s annual survey of NFL analytics staffers. “There are games where they are almost literally just like, ‘Forget the run. The only person running the ball is gonna be [quarterback] Josh Allen, and that’s it.’ There aren’t many other teams willing to do that.”
The fact that overall pass rates haven’t changed much is interesting, though, because we’ve seen a massive shift in the perceived value of the running back position.
While teams spent 3.1 first-round picks per year on running backs from 2000 to 2010, that number has sunk to 1.5 since; using the old Jimmy Johnson chart, which assigns a point value to each draft pick depending on overall odds of future value, teams spent 5,156.2 points per draft on running backs from 2000 to ’10 and only 3,649.1 since, a decline of 29%. In that same span, they’ve gone from spending 5,257.9 points per draft on quarterbacks to 6,955.1, a rise of 24%, which is impressive considering that (A) QBs have always been seen as incredibly valuable and (B) you can still fit only one quarterback on the field at a time (unless you’re the New Orleans Saints). Similarly, the value of running back contracts has failed to keep up with that of other positions.
Analytics have almost certainly played a role in the way players are valued, even if we might never know how much of a role.
“It’s like an iceberg,” Walder said. “There’s the seeable and the unseeable. Fourth downs, we can see, but it’s only a small part of the whole thing. Let’s say someone comes up with some groundbreaking way to evaluate cornerbacks, for instance — we’re not going to know about it until, like, five years later.”
“I feel like I have to apologize on behalf of analytics to all running backs,” said Schatz, one of the first people to write about and discuss analytics online. “The amount that running backs get paid has changed so much over the last 20 years. It changes how players are valued in the draft, and it changes their trade value.
“When I started this, I knew passing seemed to be more efficient, but I didn’t realize how much more efficient, and I didn’t realize just how little difference there was between running backs. The same is starting to go now for interior defensive linemen who aren’t pass-rushers, or for off-ball linebackers. We’re learning a lot about position valuation.”
At the collegiate level, there are more advantages to be found from running, and there are, let’s face it, a lot more bad quarterbacks. One would expect run rates to be higher, and they are — including sacks as pass attempts, teams ran the ball 53.0% of the time last season — but it’s jarring to realize that, despite the proliferation of the spread offense, which has helped produce more game-ready quarterbacks at the high school level, run rate has remained almost unchanged in this century: Teams also attempted rushes 53.0% of the time in 2001.
If these rates didn’t shift during the spread boom of the past 10-15 years, it’s possible they never will. Even so, Kiffin thinks other shifts could come as coaches accept analytics, potentially with fourth downs as the gateway.
“Some of our guys joke that I’m obsessed with analytics now because I use the word so much,” he said. “But I challenge my staff to look at everything. When you make recruiting decisions, let’s say you’re looking at a tight end, and there’s a guy that isn’t as good in the pass game but is better in the run game, and there’s a guy who’s a receiving tight end who doesn’t block very well. Maybe you usually take one of each, or certain coaches will have a preference for one type.
“But what would analytics say? I bet a passing tight end might be more valuable because of the value of explosive plays.” Kiffin compares a perfect block from a tight end that results in a 4-yard gain to the potential for more 20-yard gains via the pass.
Asking questions has also led Kiffin to experimentation in the transfer portal. “The whole theory of signing a ton of high school kids because you have them for five years, that’s not true anymore,” he said. “What’s gonna be the percentage that leaves now that they can?”
Indeed, Kiffin has brought in 13 transfers and counting in the 2021-22 recruiting cycle; he signed only 16 high-schoolers.
Talent acquisition is changing rapidly at the college level; Walder thinks it isn’t changing quickly enough at the pro level.
“The third area of lowest-hanging fruit” beyond fourth downs and 2-point conversions, he said, “is the draft. Teams are not paying market prices for draft picks that are remotely optimal. I’ve seen some counterpoints about top-10 draft picks, maybe, but teams are not trading in the draft at optimal prices. You basically know that if a team trades down, they did well. We shouldn’t know that.”
There is, of course, an exception for the quarterback position.
“For quarterbacks, I think we would say there’s the possibility of win-win deals,” Walder said. “It can make sense to trade up, to give up the premium, because of the upside and potential gain at the quarterback position, like the Justin Fields trade last year. But from the perspective of the team trading down, that’s irrelevant to them. They’re still gaining more value.”
“If you go back 10 or 20 years,” Burke said, “I think the price you have to pay [in the draft] has gone up for the quarterbacks, while they have maybe gone down for other position players because teams are more savvy. But human nature kind of overrides analytics — for most teams, they’re so overconfident that, ‘Yeah, this is our guy, and we can’t bear to miss out on him.’ So they trade up.”
Player tracking: the next frontier
The primary reason fourth downs and 2-point conversions were the first frontier for football analytics is because the data needed to debate them — plain old play-by-play data — could be found online for virtually any college or pro game going back more than a decade. As was the case for baseball when Statcast data came into existence, further advances would require richer data.
For a number of years at Football Outsiders, Schatz organized a game-charting project in which volunteers helped collect data on formations, the air yardage of passes and other details. But companies like Pro Football Focus and Sports Info Solutions have begun collecting and distributing that data for a few years now, making the process of tendency analysis and player evaluation faster and easier for teams and media members alike. Between the presence of GPS data at the NFL level, collected from chips in shoulder pads, and the proliferation of video software that could soon allow for player tracking at lower levels of the sport, we could see a boom of even richer data soon.
“The difference between the stuff that comes from the shoulder pads and the charting data is monumental,” Schatz said. “The stuff they’re doing with pass rush win rate and pass block win rate, for instance, you know exactly when blockers get beat. The amount of data that comes from that and the different things you can do with it — expected rushing yards, for example, which is based on the position of blockers and defenders at the moment of the handoff — it’s just phenomenal. It’s way beyond anything I thought might happen.”
Such data could help immensely when it comes to assigning credit (or blame) between a rusher and a blocker on a run play, or an offensive lineman and quarterback on a sack.
“I think the main thing teams will eventually work toward is assigning value to each player on each play,” Seth said. “In soccer, there’s a popular metric that I really like called xG Buildup, where you’re chaining events together to show how much a player is adding to his team’s expected goals as they move the ball down the field. Think about something similar for football, where you use an offense’s expected points added [EPA] for a play and divide it based on how much each player helped that EPA happen. That could really change the way we evaluate both players on the field and positional value as well.”
Burke agreed. “Any kind of individual player metric that’s able to isolate a player’s contribution to the success of a play, that’s a bit of the Holy Grail. Football is the ultimate team sport, of course, so isolating players’ contributions is really hard. But tracking gives us an opportunity to do that.”
Burke was a driving force behind the creation of ESPN’s win rates, and he’s got more plans for the future. “Next will probably be receivers,” he said, “and after that it’ll probably be defensive backs. I think that’ll be really cool.”
If there’s an even holier Holy Grail, it’s applying this same data to college football.
“College player tracking, that is coming sooner rather than later, I think,” Walder said. “There’s no way that’s not going to have a big impact, and there’s a bunch of companies that are fighting for that space — StatsBomb, Telemetry, SportLogiq, Slants — I think all four of them are attempting computer vision for college football. There might be more.”
“When these other companies actually have a viable product with college video-based tracking,” Burke noted, “all I have to do is take their data and run it through the models I’ve already got. The X and Y data [for field dimensions] is the same, and win rates are win rates. It could be for college, it could be high school, it could be a dad with a 4K camera and an app that has player tracking for his kids’, you know, peewee football. That day will come, and imagine what teams could do with that.”
Football’s Moneyball moment has arrived
Kyle Whittingham’s Utah Utes were one of CAI’s first clients, one of the first major FBS programs to decide to ride the fourth-down train. Late in a game against USC in 2016, they found themselves down 27-24 in the final minute and facing a fourth-and-1 from the Trojans’ 23. Instead of trying to take the points and send the game to overtime with a field goal, they went for the win. Zack Moss gained 5 yards to move the chains, and on the very next play Troy Williams hit Tim Patrick for an 18-yard go-ahead touchdown with 16 seconds left.
“That was just amazing to see,” McRoberts said. “You never know what they would have done [without CAI’s input], but I’m pretty sure in the past they would have elected to kick that field goal. Moments like that are pretty huge for us.”
CAI found more moments like that as Army was rising to prominence, and Kiffin’s recent exploits in the SEC have provided another shot in the arm.
It’s been more than 50 years since Cincinnati Bengals quarterback and part-time math teacher Virgil Carter created his version of an expected points model. It’s been nearly 35 years since Bob Carroll, John Thorn and Pete Palmer co-authored the seminal “Hidden Game of Football.” It’s been nearly two decades since Schatz created Football Outsiders (in 2003) and Burke started his Advanced Football Analytics blog (2007). It’s been a few years since, thanks to the efforts of The Athletic’s Ben Baldwin and others, detailed play-by-play data became available for anyone with a passing knowledge of Python, R or even Excel to begin playing and experimenting with.
One could make a pretty good case that football’s “Moneyball” moment was past due. NFL teams have all begun amassing teams of nerds — Baltimore Ravens analyst Sarah Mallepalle described herself as coming from “Analytics Twitter” on a panel at the recent Sloan Sports Analytics Conference. At the college level, companies such as CAI and SportSource Analytics and even student groups like the Michigan Football Analytics Society, to which Seth once belonged, have found the ears of increasingly trustful coaches. The sudden increase in (some) coaches’ willingness to go for it on fourth down around 2018 has continued to pick up steam. And again, that’s only the progress that we can see.
“I’ve talked to people” — like Mallepalle — “who work on the personnel side,” Burke said, “and while they’re not doing anything cosmic, they’re setting up the scouts and decision-makers with the information they need. You can go deeper [in your scouting], you can rule people out quicker and not waste time, and it makes the front office’s job more efficient and effective.”
“What we discovered early on,” McRoberts said, “was just talking to coaches about their own games and the situations that have come up in the past — like, hey, here’s what you did, here’s what the numbers would have recommended, and here’s why. They may not 100% follow what it is you’re doing, but they are very interested to see what the numbers say and how that would align with what they’ve done in the past.”
Seth drew reference to the trends that formed in other sports thanks to the proliferation of analytics — the increased emphasis on on-base percentage in baseball (or barrels, if you’re into the Statcast data) or 3-pointers and layups in basketball.
“In football, I’m really curious to see how these new edges are gained when more and more teams begin behaving more optimally,” he said.
While some have complained that these developments have made baseball and basketball more boring, football might not suffer the same issue — not many casual fans would complain about games with more high-leverage fourth-down attempts and 2-point conversions and perhaps more passing. But that would just be the beginning of the cat-and-mouse game.
“What other advantages do more analytically inclined teams find?” Seth asked. “What happens when the rest of the league catches up to them?”
Seven years ago at SB Nation, I wrote a piece about where I hoped football analytics (college in particular) might go. A couple of years after writing it, I’m not sure we could have checked many boxes. But the pace is picking up in a hurry … whether the old-schoolers and point-takers like it or not.